What is a living wage and how is it estimated?
Today, families and individuals working in low-wage jobs make too little income to meet minimum standards of living in their community. But just how much do families need to meet these standards? Policymakers often turn to measures like the federal poverty line – a national number based on three times the cost of a minimum food diet in 1963 – to answer that question. However these benchmarks no longer reflect the true cost of living in a modern economy. The Living Wage Calculator was originally developed in 2003 to more comprehensively estimate the employment earnings – or the living wage – that a full-time worker requires to cover or support the costs of their family’s basic needs where they live. Now, the calculator features geographically-specific costs for food, childcare, health care, housing, transportation, other basic needs – like clothing, personal care items, and broadband, among others – and taxes at the county, metro, and state levels for 12 different family types.
Read on for an overview of how the living wage is calculated or dive into the technical documentation produced by the Living Wage Institute for a more detailed description of the estimation methodology.
Overview
At its simplest, a living wage is what one full-time worker must earn on an hourly basis to help cover the cost of their family’s minimum basic needs where they live while still being self-sufficient. Here’s a quick guide for what you need to know about the living wage data you see on the calculator.
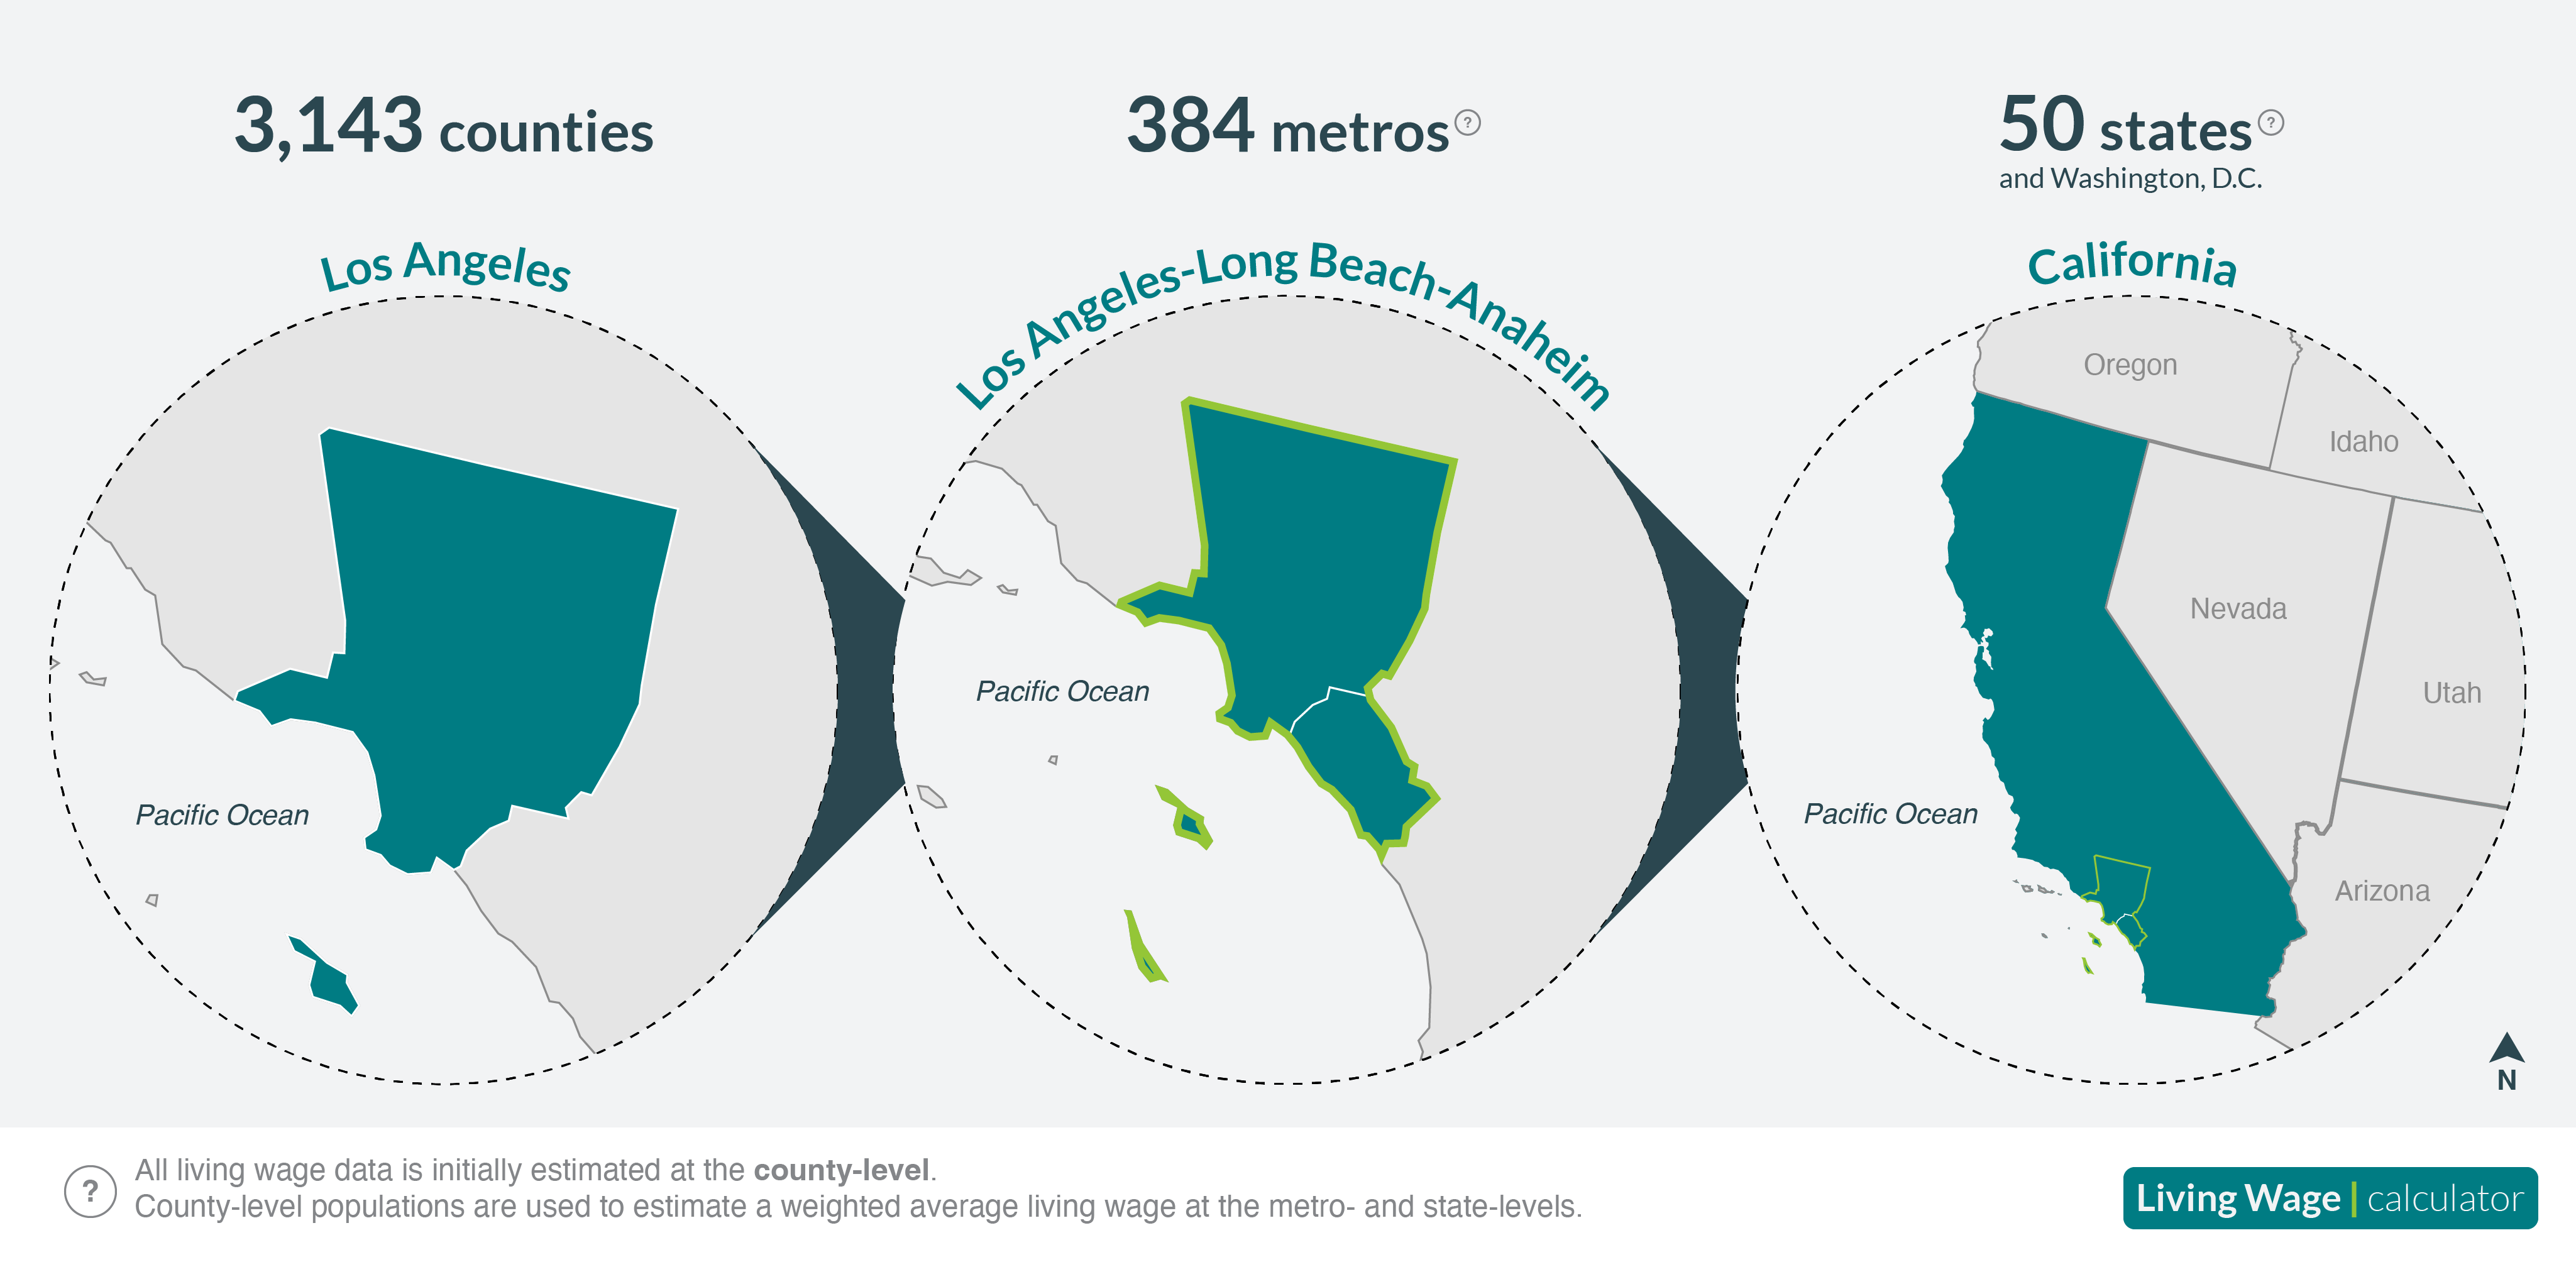
GEOGRAPHY
The calculator includes living wage estimates for 3,143 counties to account for the geographic variation in costs across the U.S. The data is also available for 384 Metropolitan Statistical Areas (MSAs or metros) and 50 states plus Washington, D.C.
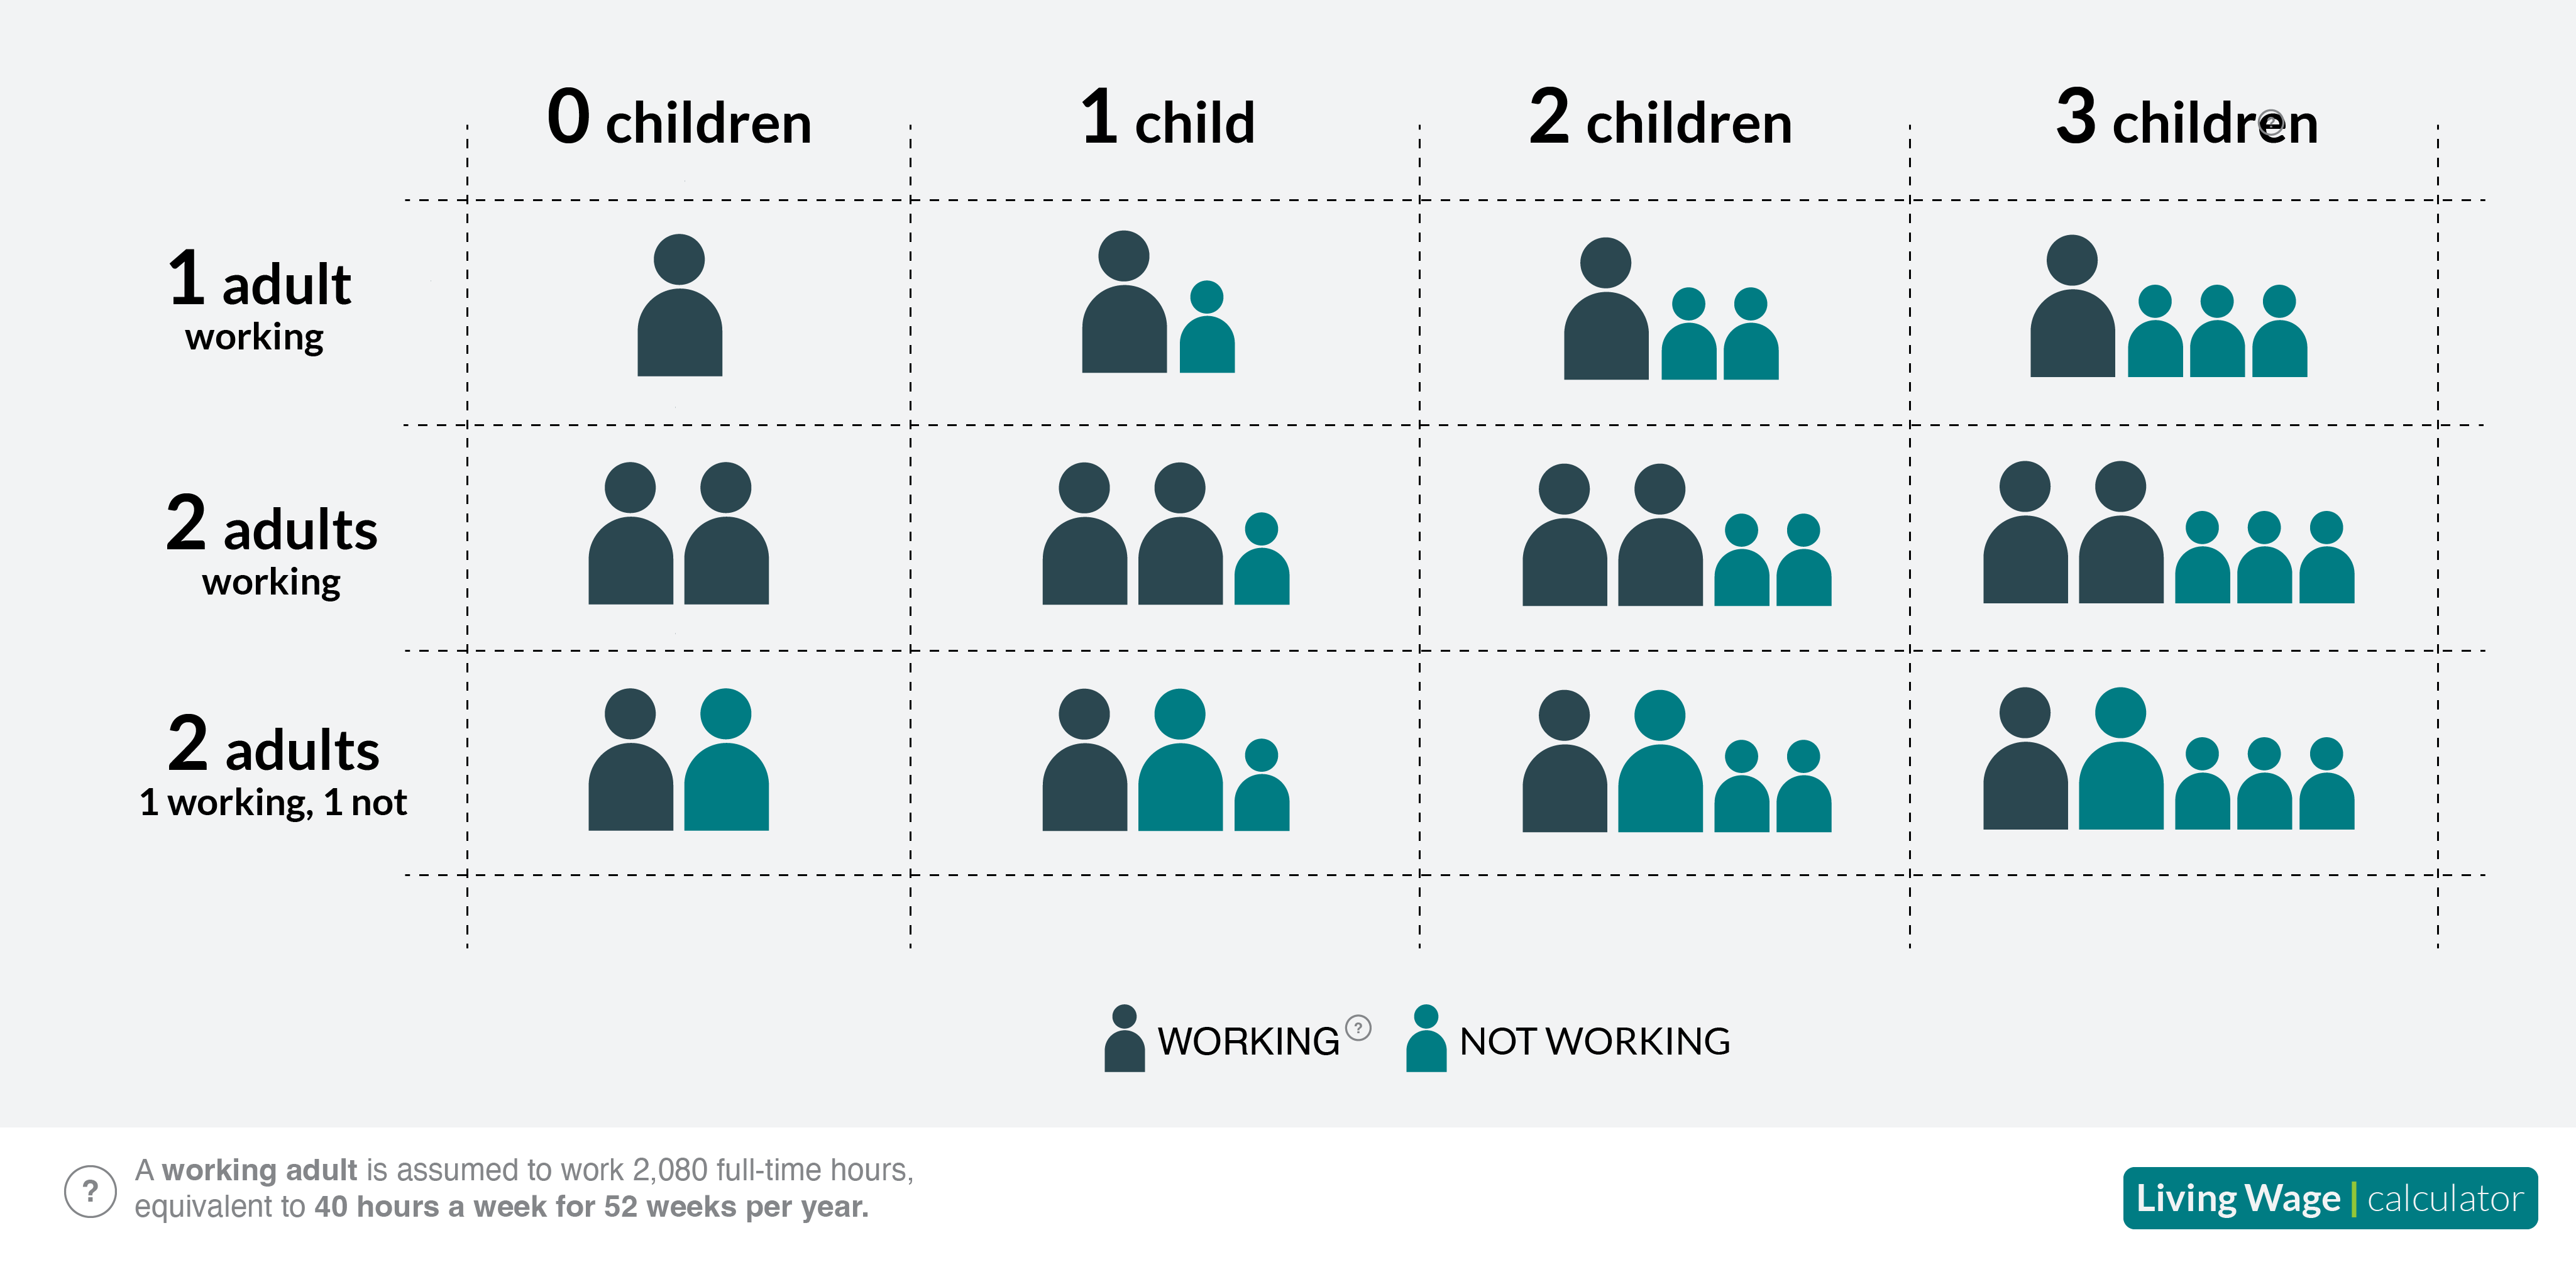
FAMILY TYPE
For each geography, there is a living wage estimate for 12 family types, with varying numbers of adults and children as detailed in the graphic below. It’s important to note that in households with multiple full-time working adults, the living wage is what one of them would need to earn hourly at a full-time job, assuming the other is also earning the same.
BASIC NEEDS
There are eight basic needs – food, childcare, health care, housing, transportation, civic engagement, broadband, and other necessities – that make up the cost components of the living wage, with an additional cost associated with income and payroll taxes. Use the table below to explore the data sources for each of these components included in the living wage estimates for 2025. Because each source includes data from different years, all data used in calculating a living wage is adjusted for inflation to December 2024 dollars using expenditure-specific indexes from Consumer Price Index-All Urban Consumers (CPI-U).
| Component | Data Date | Source |
|---|---|---|
| Childcare | 2024; 2020 | U.S. Department of Labor, Women’s Bureau, National Database of Childcare Prices (2019-2022); Child Care Aware, Child Care at a Standstill: Price and Landscape Analysis (Appendices) |
| Food | June 2024 | USDA Food Plans: Cost of Food Reports |
| Health Care | 2023 | Health Insurance Premiums: Medical Expenditure Panel Survey Health Insurance Component Analytical Tool (MEPSnet/IC) |
| 2023 | Out-of-Pocket Medical Expenses: U.S. Bureau of Labor Statistics Consumer Expenditure Survey, Table 1400 and 1502 (Drugs; Medical services; and Medical supplies) | |
| Housing | October 2024 | U.S. Department of Housing and Urban Development Fair Market Rents (40th Percentile Rents) |
| Internet & Mobile | 2020 | BroadbandNow United States County Broadband Statistics for 2020 |
| 2023 | U.S. Bureau of Labor Statistics Consumer Expenditure Survey, Table 1400 and 1502 (Cellular phone service) | |
| Transportation | 2023; 2019 | U.S. Bureau of Labor Statistics Consumer Expenditure Survey, Table 1400 and 1502 (Cars and trucks (used); Gasoline and motor oil; Other vehicle expenses; and Public transportation); Center for Neighborhood Technology, H&T Index |
| Civic Engagement | 2023 | U.S. Bureau of Labor Statistics Consumer Expenditure Survey, Table 1400 and 1502 (Entertainment: fees and admissions; Audio and visual equipment and services; Pets; Toys, hobbies, and playground equipment; Entertainment: other supplies, equip., & services; Reading; and Education) |
| Other Necessities | 2023 | U.S. Bureau of Labor Statistics Consumer Expenditure Survey, Table 1400 and 1502(Apparel and services; Housekeeping supplies; Personal care products and services; Household furnishings and equipment; and Miscellaneous household equipment) |
| Income and Payroll Taxes | 2023 | National Bureau of Economic Research, TAXSIM (v35) |
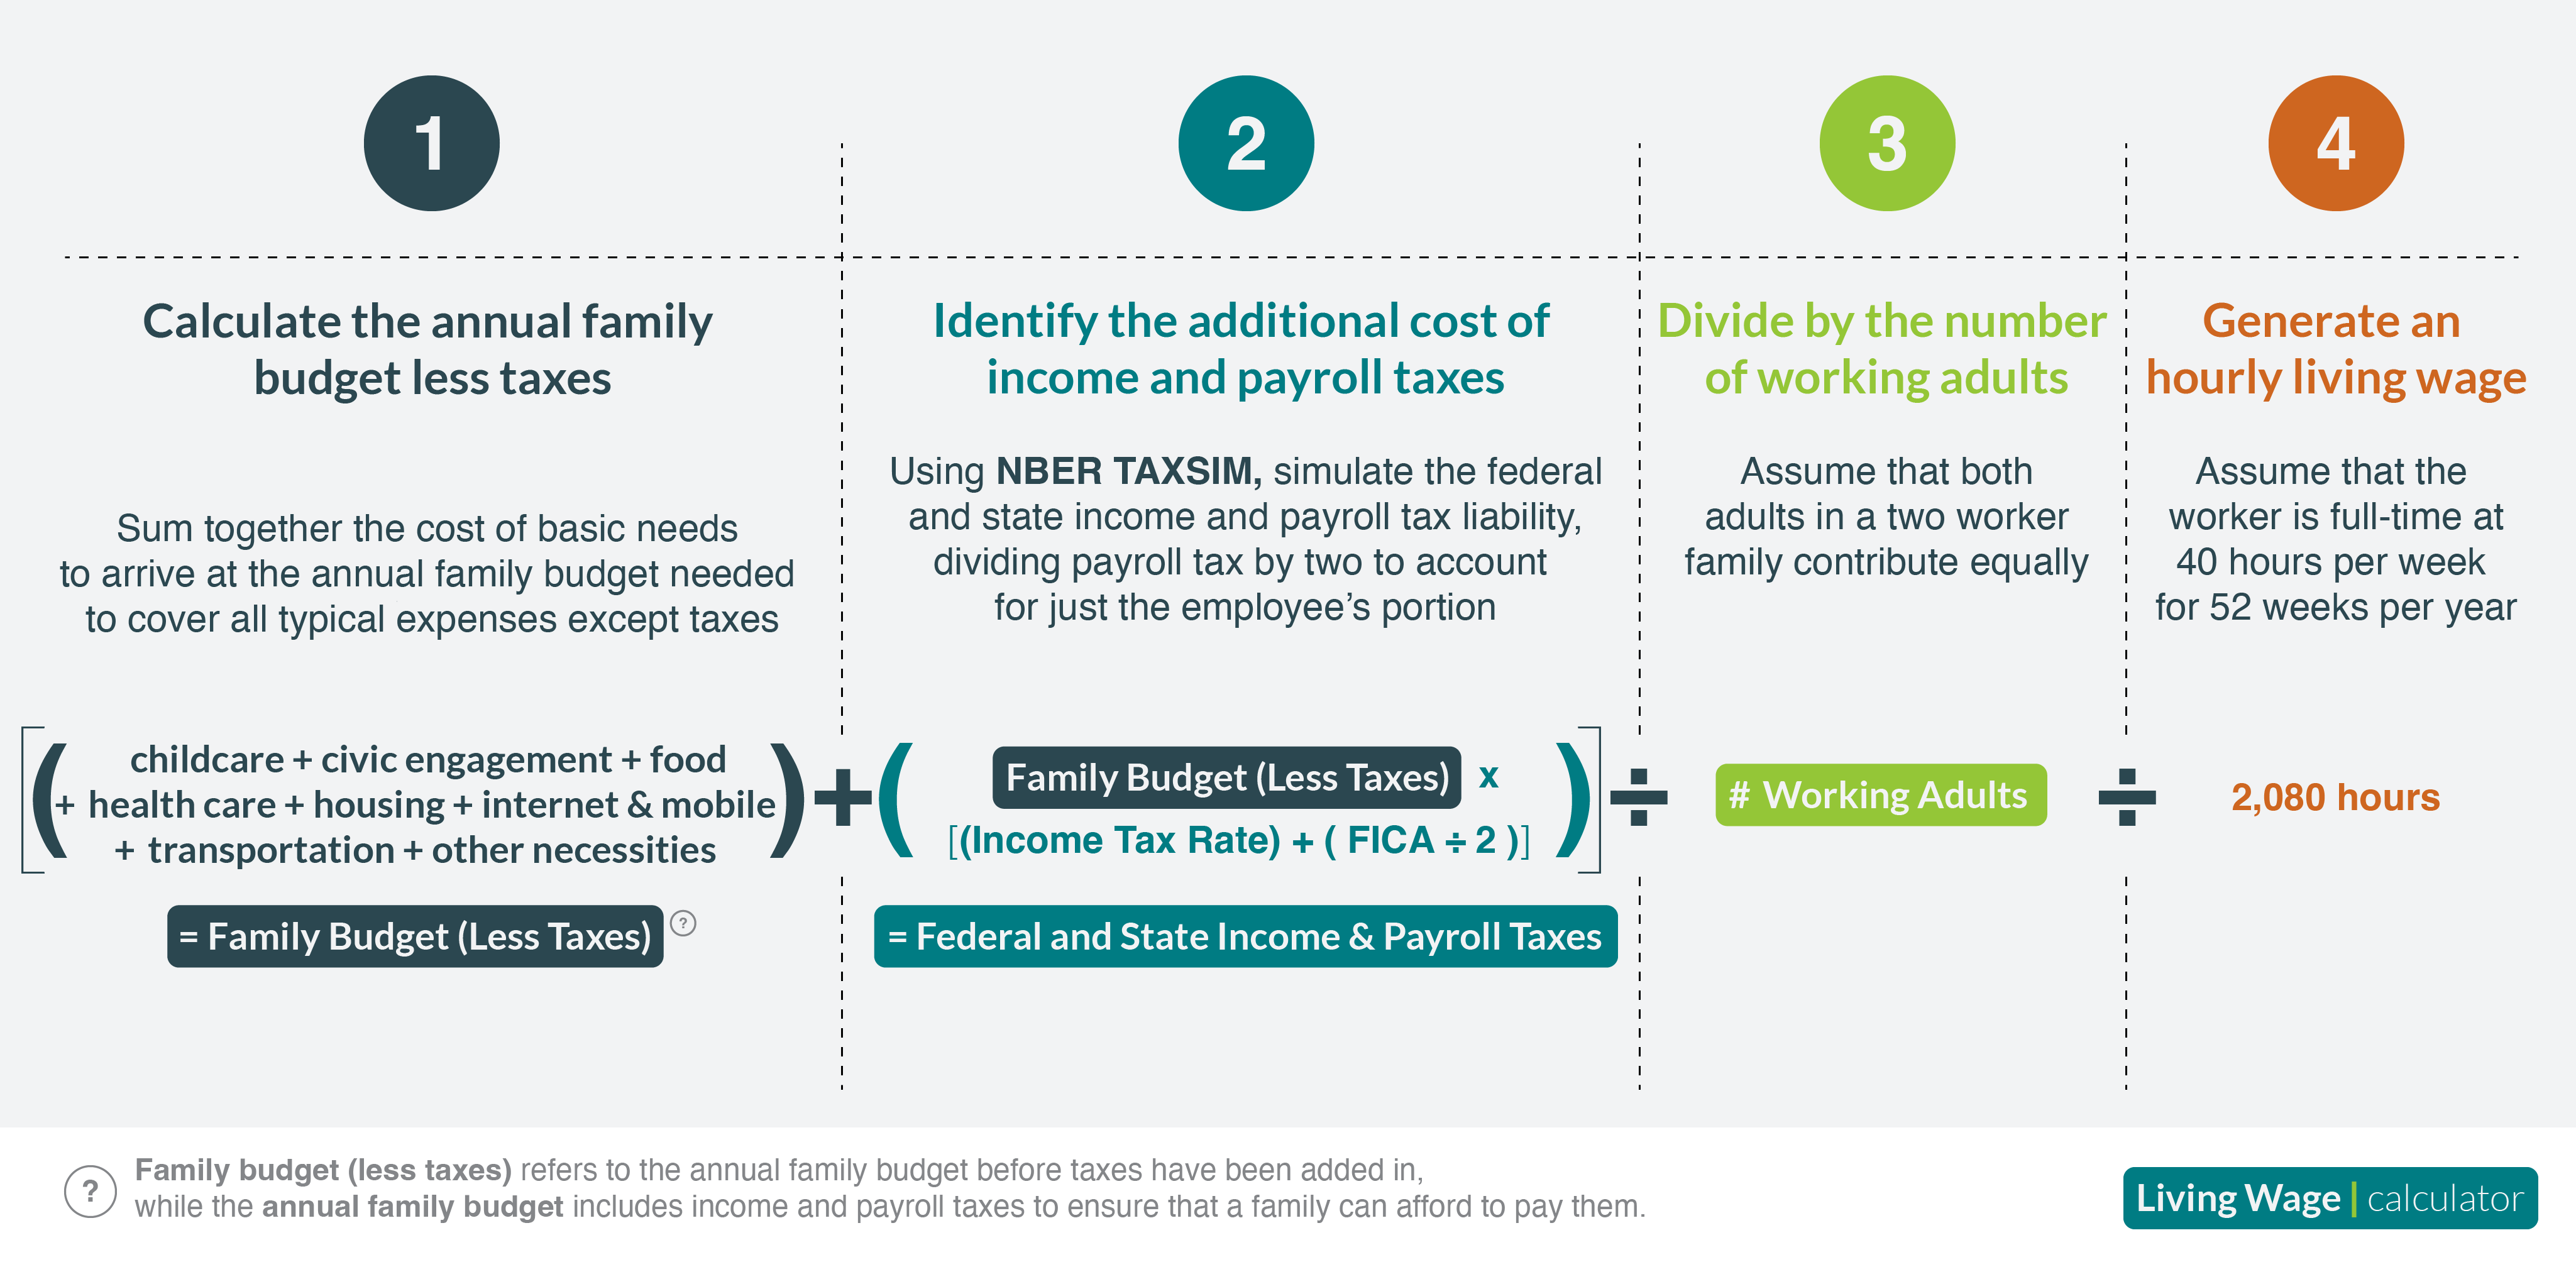
FAMILY BUDGET AND LIVING WAGE CALCULATION
The underlying data on the cost of basic needs is used to calculate the actual hourly living wage for each county and each family type through a four step process, summarized in the figure below.
What are basic needs?
The Living Wage Calculator’s estimates are based on the costs of eight components, each of which represents a basic need: childcare, civic engagement, food, health care. housing, internet & mobile, transportation, and other necessities. It also includes relevant income and payroll taxes, but how they are determined will be covered in the following section. In general, it is assumed that families select the lowest cost option that enables them to meet each of these basic needs at a minimum but adequate level. As such, the living wage does not budget for eating out at a restaurant or meals that aren’t prepared at home; leisure time, holidays, or unpaid vacations; or savings, retirement, and other long-term financial investments.
Below, explore the definitions and underlying data sources for each of the cost components of a living wage.
How is a living wage calculated?
The cost estimate for each basic need are used to calculate the hourly living wage in four steps for each of the 3,143 counties. Then, an additional step aggregates county-level living wages into metro- and state-level estimates.
While property and sales taxes are already considered in the estimated cost of each basic need, the additional cost of income and payroll taxes are appraised using the National Bureau of Economic Research's TAXSIM, a microsimulation model of the U.S. federal and state income tax system. For the inputs into the model, the annual family budget after taxes is used as a proxy for income; the family composition determines the filing status and number of dependents; and the county helps identify the state of residence. Based on these inputs, the TAXSIM model output multiplies the annual family budget after taxes by the marginal tax rate to roughly estimate an output for the amount owed in federal and state income and payroll taxes, assuming that an employer covers half – or 7.65% – of the Federal Insurance Contributions Act (FICA) payroll tax liability. The federal and state income and payroll taxes are added to the annual family budget less taxes, yielding the total annual family budget needed to meet all basic needs, including tax.
METRO- AND STATE-LEVEL LIVING WAGES
While similar goods and services are available across the U.S., factors like state and local tax rates, market demand, competition, shipping, logistical costs, and seasons, among others can greatly impact the local prices of basic needs. To account for this localized variation in costs, the Living Wage Calculator data is computed and primarily meant to be used at the county-level. For ease of reporting, however, we also provide living wage estimates for 384 Metropolitan Statistical Areas – more commonly called MSAs or metros – and each of the 50 states plus Washington, D.C. To aggregate county-level data to these larger geographic areas, where applicable, we use county population estimates from the U.S. Census Bureau to take a weighted average of the living wage – or its underlying components – across counties.
What’s different between this year and last year?
While the methodology to calculate a living wage remains relatively consistent year-over-year, changes in the underlying data sources can increase or decrease the estimates for the cost of basic needs or the living wage overall each year.
This year, we preserved most of our methodology and mainly focused on updating the underlying datasets for the most recent data. To account for some persistent issues with underprediction in costs for larger families, we applied a family size index that accounts for both the size and composition of consumer units to all data from the Consumer Expenditure Survey. This change affected living wage estimates for families with five people.
Want to learn more?
To learn even more about the methodology behind the data featured on the Living Wage Calculator, please read the technical documentation produced by the Living Wage Institute or submit a question through the Contact page.